PRESENTED AT: ASRM 2019, Philadelphia, Pennsylvania
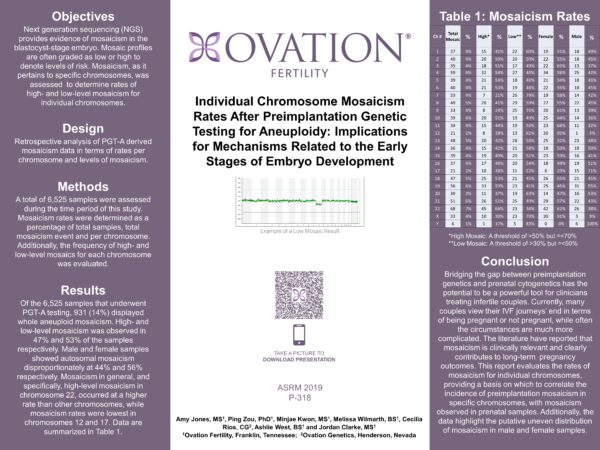
OBJECTIVE: Next generation sequencing (NGS) provides evidence of mosaicism in the blastocyst stage embryo. Mosaic profiles are often graded as low or high to denote levels of risk. Here we assess mosaicism as it pertains to specific chromosomes and determine rates of high and low level mosaicism for individual chromosomes.
DESIGN: Retrospective study
MATERIALS AND METHODS: A total of 6525 samples were assessed during the time period of this study. Mosaicism rates were determined as a percentage of total samples, total mosaicism event and per chromosome. Additionally, we evaluated the frequency of high and low level mosaics for each chromosome.
RESULTS: Of the 6525 samples that underwent PGT-A testing 931 (14%) displayed whole aneuploid mosaicism. High and low level mosaicism was observed in 47% and 53% of the samples respectively. Male and female samples showed autosomal mosaicism disproportionately at 44% and 56% respectively. Mosaicism and high level mosaicism in chromosome 22 occurred at a higher rate than other chromosomes, while mosaicism rates were lowest in chromosomes 12 and 17. Data are summarized in Table I.
| Table I | ||||||||||
| Ch # | Total Mosaic | High | Low | Female | Male | |||||
| 1 | 37 | 4.0% | 15 | 40.5% | 22 | 59.5% | 19 | 51.4% | 18 | 48.6% |
| 2 | 40 | 4.3% | 20 | 50.0% | 20 | 50.0% | 22 | 55.0% | 18 | 45.0% |
| 3 | 35 | 3.8% | 18 | 51.4% | 17 | 48.6% | 22 | 62.9% | 13 | 37.1% |
| 4 | 59 | 6.3% | 32 | 54.2% | 27 | 45.8% | 34 | 57.6% | 25 | 42.4% |
| 5 | 39 | 4.2% | 21 | 53.8% | 18 | 46.2% | 21 | 53.8% | 18 | 46.2% |
| 6 | 40 | 4.3% | 21 | 52.5% | 19 | 47.5% | 22 | 55.0% | 18 | 45.0% |
| 7 | 33 | 3.5% | 7 | 21.2% | 26 | 78.8% | 19 | 57.6% | 14 | 42.4% |
| 8 | 49 | 5.3% | 20 | 40.8% | 29 | 59.2% | 27 | 55.1% | 22 | 44.9% |
| 9 | 33 | 3.5% | 8 | 24.2% | 25 | 75.8% | 20 | 60.6% | 13 | 39.4% |
| 10 | 39 | 4.2% | 20 | 51.3% | 19 | 48.7% | 25 | 64.1% | 14 | 35.9% |
| 11 | 34 | 3.7% | 15 | 44.1% | 19 | 55.9% | 23 | 67.6% | 11 | 32.4% |
| 12 | 21 | 2.3% | 8 | 38.1% | 13 | 61.9% | 20 | 95.2% | 1 | 4.8% |
| 13 | 48 | 5.2% | 20 | 41.7% | 28 | 58.3% | 25 | 52.1% | 23 | 47.9% |
| 14 | 36 | 3.9% | 15 | 41.7% | 21 | 58.3% | 18 | 50.0% | 18 | 50.0% |
| 15 | 39 | 4.2% | 19 | 48.7% | 20 | 51.3% | 23 | 59.0% | 16 | 41.0% |
| 16 | 37 | 4.0% | 17 | 45.9% | 20 | 54.1% | 18 | 48.6% | 19 | 51.4% |
| 17 | 21 | 2.3% | 10 | 47.6% | 11 | 52.4% | 6 | 28.6% | 15 | 71.4% |
| 18 | 47 | 5.0% | 25 | 53.2% | 21 | 44.7% | 26 | 55.3% | 21 | 44.7% |
| 19 | 56 | 6.0% | 33 | 58.9% | 23 | 41.1% | 25 | 44.6% | 31 | 55.4% |
| 20 | 30 | 3.2% | 11 | 36.7% | 19 | 63.3% | 14 | 46.7% | 16 | 53.3% |
| 21 | 51 | 5.5% | 26 | 51.0% | 25 | 49.0% | 29 | 56.9% | 22 | 43.1% |
| 22 | 68 | 7.3% | 45 | 66.2% | 23 | 33.8% | 42 | 61.8% | 26 | 38.2% |
| X | 33 | 3.5% | 10 | 30.3% | 23 | 69.7% | 30 | 90.9% | 3 | 9.1% |
| Y | 6 | 0.6% | 1 | 16.7% | 5 | 83.3% | 0 | 0.0% | 6 | 100.0% |
CONCLUSIONS: Bridging the gap between preimplantation genetics and prenatal cytogenetics has the potential to be a powerful tool for clinicians treating infertile couples. The literature has reported that mosaicism is clinically relevant. This report evaluates the rates of mosaicism for individual chromosomes providing a basis on which to correlate the incidence of preimplantation mosaicism in specific chromosomes with mosaicism observed in prenatal samples. Additionally, the data highlights the putative uneven distribution of mosaicism in male and female samples.
Poster